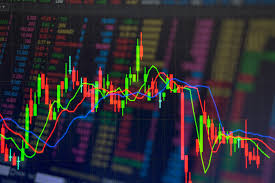
Technical analysis is a crucial skill for traders who want to make informed decisions in the cryptocurrency market.
It involves analyzing historical price movements and market trends to predict future price actions.
Unlike fundamental analysis, which focuses on a crypto asset’s underlying value, technical analysis is based purely on charts, patterns, and indicators.
Why is Technical Analysis Important in Crypto Trading?
The crypto market is highly volatile, meaning prices can fluctuate significantly within short periods.
By using technical analysis, traders can identify trends, price patterns, and potential entry and exit points, helping them minimize risks and maximize profits.
This approach allows traders to anticipate market movements rather than react to them blindly.
Key Concepts in Crypto Technical Analysis
1. Price Trends
A price trend is the overall direction in which the market is moving. Trends can be upward (bullish), downward (bearish), or sideways (consolidation).
Recognizing a trend early can help traders take advantage of price movements before they happen.
2. Support and Resistance Levels
Support is the price level where an asset tends to stop falling and bounce back up due to increased buying interest.
Resistance, on the other hand, is where prices struggle to move higher because of selling pressure. Identifying these levels helps traders determine the best points to enter or exit a trade.
3. Candlestick Patterns
Candlestick charts provide valuable information about market sentiment. Some common patterns include:
- Doji – Indicates market indecision.
- Hammer – Suggests a potential reversal from a downtrend.
- Engulfing Pattern – A strong signal of a trend reversal.
By understanding these patterns, traders can predict potential price movements with more accuracy.
4. Technical Indicators
Indicators help traders analyze price data more effectively. Some of the most commonly used indicators in crypto trading include:
- Moving Averages (MA): These smooth out price data to show the overall trend. The 50-day and 200-day moving averages are widely used.
- Relative Strength Index (RSI): This measures whether an asset is overbought or oversold, helping traders determine possible trend reversals.
- MACD (Moving Average Convergence Divergence): This indicator helps traders identify momentum shifts and potential buy or sell opportunities.
5. Volume Analysis
Trading volume represents the number of assets being bought or sold in a given period. High volume during an uptrend indicates strong buying pressure, while high volume during a downtrend signals strong selling pressure. Monitoring volume helps traders confirm the strength of a trend.
How to Use Technical Analysis for Crypto Trading
- Identify Market Trends: Analyze price charts to determine whether the market is in an uptrend, downtrend, or sideways movement.
- Use Support and Resistance Levels: Plan your trades around key levels to minimize risks and increase potential profits.
- Check Technical Indicators: Use indicators like RSI, MACD, and moving averages to confirm your analysis before making a trade.
- Watch Market Volume: Ensure that price movements are supported by strong volume to validate trends.
- Practice and Improve: The more you analyze charts and practice, the better your technical analysis skills will become.
Final Thoughts
Crypto technical analysis may seem complex at first, but with consistent practice and a clear understanding of key concepts, it becomes an invaluable tool for making smarter trading decisions.
Whether you are a beginner or an experienced trader, using technical analysis can give you an edge in the highly volatile crypto market.
Join Gen z and millennials TaskForce official 2025 WhatsApp Channel To Stay Updated On time the ongoing situation https://whatsapp.com/channel/0029VaWT5gSGufImU8R0DO30


